While we try to keep things accurate, this content is part of an ongoing experiment and may not always be reliable.
Please double-check important details — we’re not responsible for how the information is used.
Climate
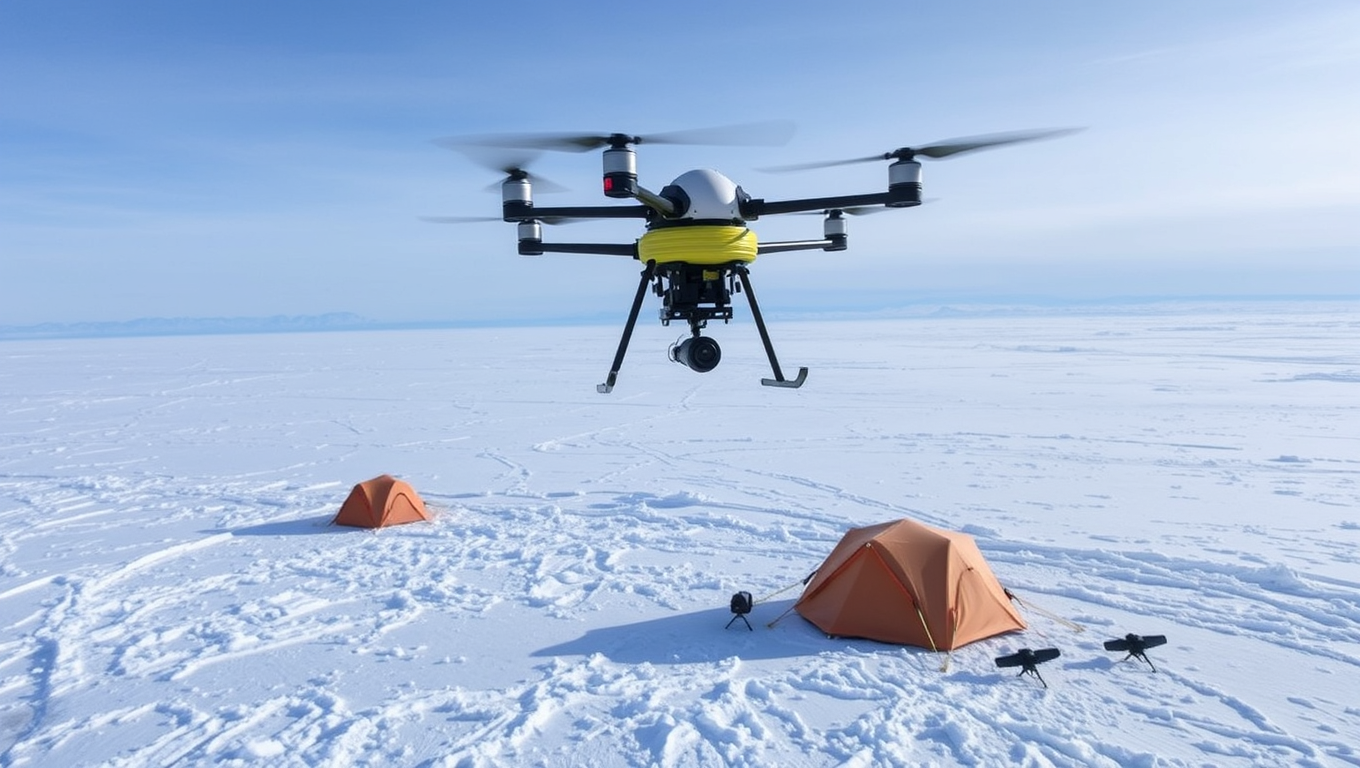
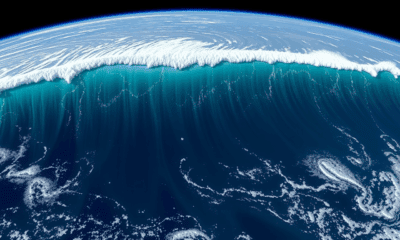
“Drone Experiment Reveals How Greenland Ice Sheet is Changing: Unlocking the Secrets of Water Vapor”
A new study measured water vapor in Greenland’s air, collecting data crucial for improving climate models and forecasting Arctic changes.


Climate
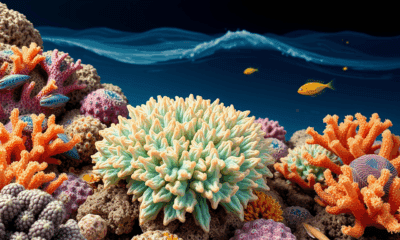
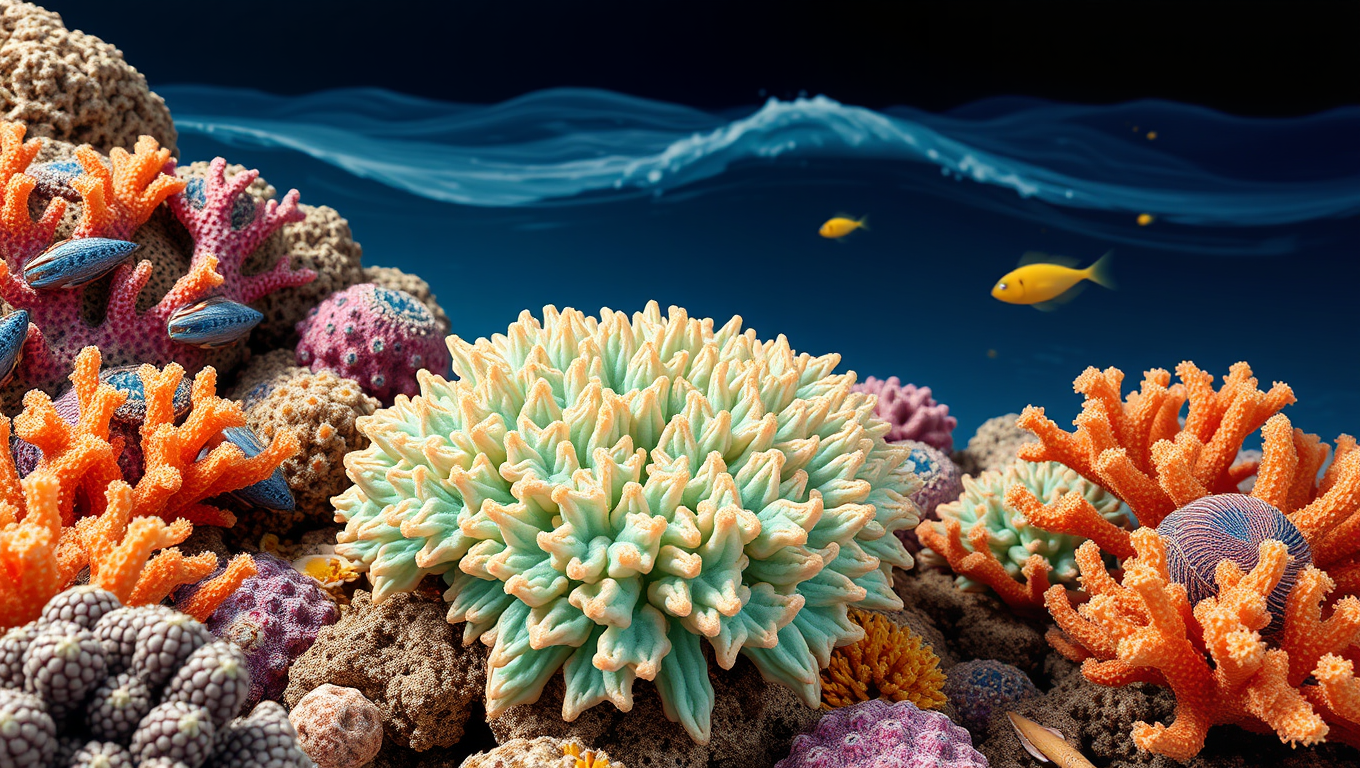
The Ocean’s Fragile Fortresses: Uncovering the Impact of Climate Change on Bryozoans
Mediterranean bryozoans, including the “false coral,” are showing alarming changes in structure and microbiomes under acidification and warming. Field studies at volcanic CO₂ vents reveal that these stressors combined sharply reduce survival, posing risks to marine ecosystems.
Climate
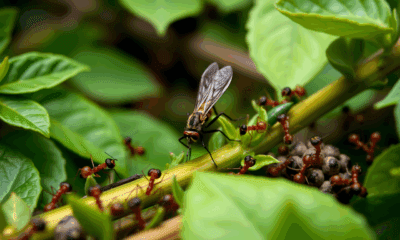
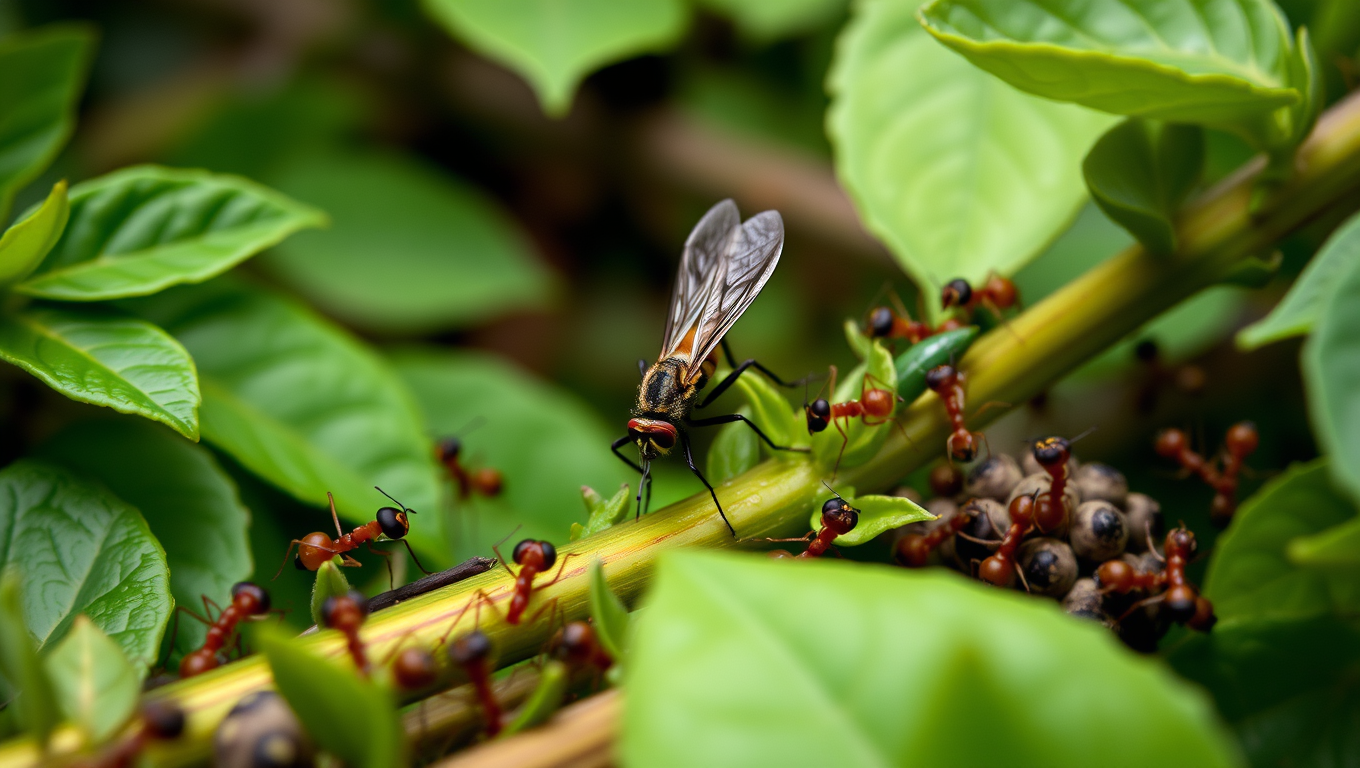
Unraveling Chaotic Ant Wars to Save Coffee: The Complexities of Ecological Systems in Agriculture
In a Puerto Rican coffee farm, researchers uncovered a web of chaotic interactions between three ant species and a predator fly, revealing how shifting dominance patterns make pest management unpredictable. By combining theories of cyclic dominance and predator-mediated coexistence, they showed how ecological forces oscillate and intertwine, creating patterns too complex for simple forecasting. This deep dive into ant behavior underscores both the potential and the challenges of replacing pesticides with ecological methods, as nature’s own “rules” prove to be far from straightforward.
Climate
“Hidden Wonders: Scientists Stunned by Colossal Formations Under the North Sea”
Beneath the North Sea, scientists have uncovered colossal sand formations, dubbed “sinkites,” that have mysteriously sunk into lighter sediments, flipping the usual geological order. Formed millions of years ago by ancient earthquakes or pressure shifts, these giant structures could reshape how we locate oil, gas, and safe carbon storage sites. The discovery not only challenges established geology but also introduces a new partner phenomenon, “floatites,” and sparks debate among experts.

A New Horizon for Vision: How Gold Nanoparticles May Restore People’s Sight

Retiring Abroad Can Be Lonely Business

Revolutionizing Quantum Communication: Direct Connections Between Multiple Processors
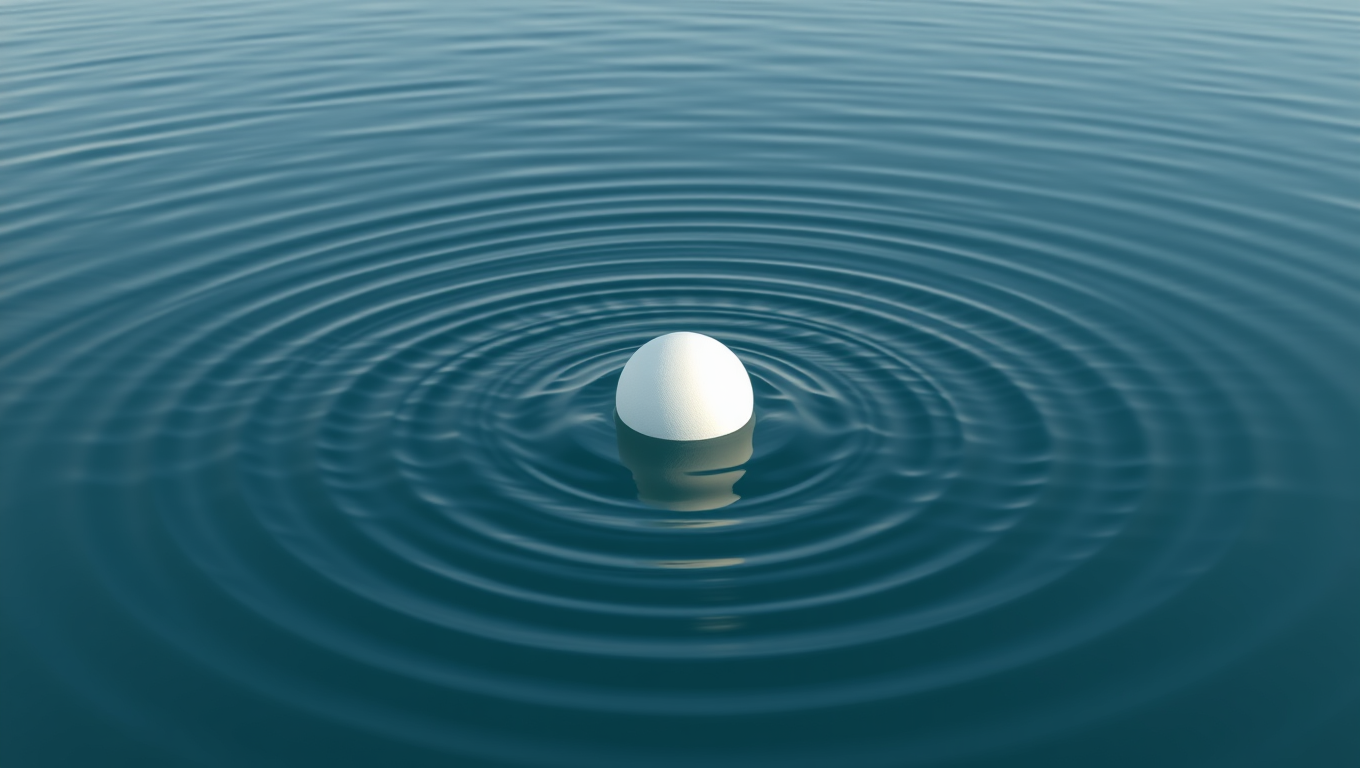
Harnessing Water Waves: A Breakthrough in Controlling Floating Objects

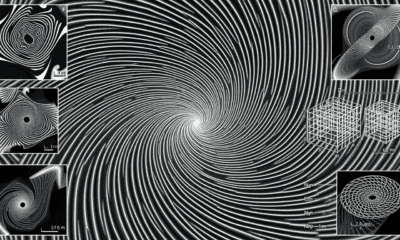
“Unveiling Hidden Patterns: A New Twist on Interference Phenomena”

Household Electricity Three Times More Expensive Than Upcoming ‘Eco-Friendly’ Aviation E-Fuels, Study Reveals

“A Sustainable Solution: Researchers Create Hybrid Cheese with 25% Pea Protein”
-
 Detectors11 months ago
A New Horizon for Vision: How Gold Nanoparticles May Restore People’s Sight
-
Earth & Climate12 months ago
Retiring Abroad Can Be Lonely Business
-
Cancer12 months ago
Revolutionizing Quantum Communication: Direct Connections Between Multiple Processors
-
Albert Einstein12 months ago
Harnessing Water Waves: A Breakthrough in Controlling Floating Objects
-
Chemistry11 months ago
“Unveiling Hidden Patterns: A New Twist on Interference Phenomena”
-
Earth & Climate11 months ago
Household Electricity Three Times More Expensive Than Upcoming ‘Eco-Friendly’ Aviation E-Fuels, Study Reveals
-
Agriculture and Food12 months ago
“A Sustainable Solution: Researchers Create Hybrid Cheese with 25% Pea Protein”
-
Diseases and Conditions12 months ago
Reducing Falls Among Elderly Women with Polypharmacy through Exercise Intervention