Connect with us

Climate

Losing Forest Carbon Stocks Could Put Climate Goals Out of Reach

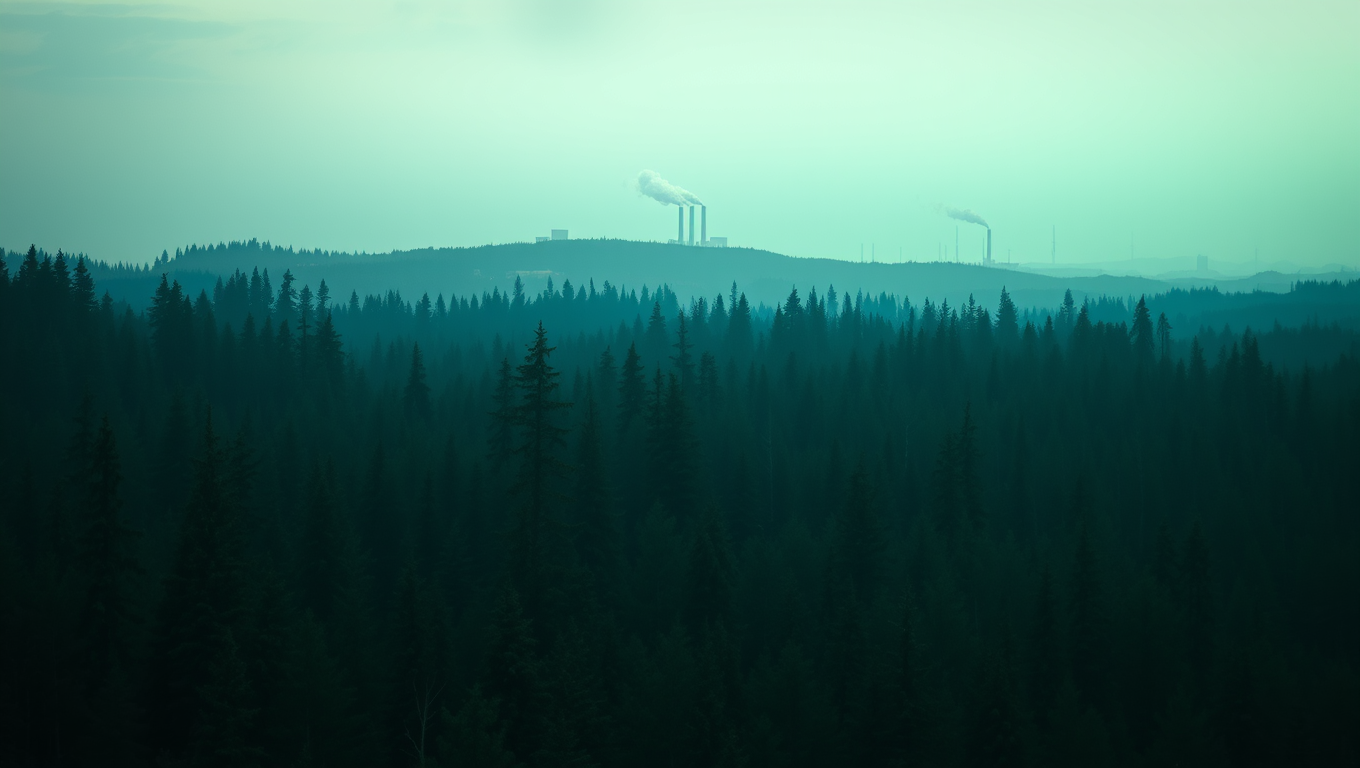
In the past, intact forests absorbed 7.8 billion tons of CO2 annually — about a fifth of all human emissions — but their carbon storage is increasingly at risk from climate change and human activities such as deforestation. A new study shows that failing to account for the potentially decreasing ability of forests to absorb CO2 could make reaching the Paris agreement targets significantly harder, if not impossible, and much more costly.
Avatar photo

Published

on

Losing Forest Carbon Stocks Could Put Climate Goals Out of Reach

Intact forests have long been a vital component in the fight against climate change. These natural wonders absorb massive amounts of CO2, about a fifth of all human emissions, every year. However, their carbon storage capabilities are increasingly at risk due to climate change and human activities like deforestation.

A recent study from the Potsdam Institute for Climate Impact Research (PIK) highlights that failing to account for the potentially decreasing ability of forests to absorb CO2 could make reaching Paris agreement targets significantly harder, if not impossible. The study’s lead author, Michael Windisch, emphasizes that “delaying action leads to disproportionately higher costs.” Our current climate strategies rely on forests remaining intact and expanding, but escalating wildfires like those in California and continued deforestation in the Amazon threaten this gamble.

Climate change itself puts immense pressure on forest carbon stores. According to the study, postponing action to reduce emissions and protect forests could jeopardize climate targets. Windisch stresses that “we must act immediately to safeguard the carbon stored in forests.” Otherwise, compensating for potential forest carbon losses through steeper emissions cuts in key sectors like energy, industry, and transport will become increasingly expensive and possibly unattainable.

The study analyzed how climate targets can be met despite forests’ reduced capacity for storing carbon. Using integrated global land and water use modeling as well as an energy-economy modeling system, the research team compared foresighted policy responses with delayed and myopic approaches. The results revealed that even a five-year delay in responding to forest carbon loss would lead to a roughly two-fold increase in both the stringency and overall cost of measures to offset that lost carbon.

The study also highlighted that current models may be overly optimistic about future forest carbon storage, ignoring disturbances, overvaluing CO2 fertilization, and underestimating deforestation. To mitigate climate impacts, safeguard carbon stocks, and prevent escalating costs, scientists recommend immediate action. They stress the need for stronger forest conservation, faster decarbonization, and realistic forest carbon projections.

As Alexander Popp, head of PIK’s Land Use Transition lab, concludes: “Staying below critical warming thresholds requires more than just hoping forests will remain intact.” Alongside protecting forests, it is essential to promote sustainable land use practices – not only to preserve biodiversity but also to avoid drastic economic consequences and secure our climate future.

Climate

The Wealthy Elite’s Carbon Footprint: A Study Reveals the True Extent of Global Warming Since 1990

Wealthy individuals have a higher carbon footprint. A new study quantifies the climate outcomes of these inequalities. It finds that the world’s wealthiest 10% are responsible for two thirds of observed global warming since 1990 and the resulting increases in climate extremes such as heatwaves and droughts.

Avatar photo

Published

on

The study published in Nature Climate Change sheds light on the disproportionate impact of the world’s wealthiest individuals on global warming since 1990. According to the research, the top 10% of the global population is responsible for two-thirds of observed global warming and the resulting increases in climate extremes such as heatwaves and droughts.

The study assesses the contribution of high-emitting groups within societies, finding that the top 1% of the wealthiest individuals globally have a carbon footprint 26 times higher than the global average when it comes to monthly 1-in-100-year heat extremes. This also applies to Amazon droughts, with these emissions being 17 times more detrimental.

Lead author Sarah Schöngart explains, “Our study shows that extreme climate impacts are not just the result of abstract global emissions but can be directly linked to our lifestyle and investment choices, which in turn are linked to wealth.”

Using a novel modeling framework combining economic data and climate simulations, researchers were able to trace emissions from different global income groups. They found that emissions from the wealthiest 10% in the United States and China alone led to a two-to threefold increase in heat extremes across vulnerable regions.

The study’s findings are clear: if everyone had emitted like the bottom 50% of the global population, the world would have seen minimal additional warming since 1990. Coauthor Carl-Friedrich Schleussner emphasizes that addressing this imbalance is crucial for fair and effective climate action.

Moreover, the research highlights the importance of emissions embedded in financial investments rather than just personal consumption. Targeting the financial flows and portfolios of high-income individuals could yield substantial climate benefits.

“This is not an academic discussion – it’s about real impacts of the climate crisis today,” says Schleussner. “Climate action that doesn’t address outsize responsibilities of wealthiest members society risks missing one most powerful levers we have to reduce future harm.”

The authors suggest that their findings could motivate progressive policy instruments targeted at societal elites, noting such policies can foster social acceptance of climate action. Making rich individual polluters pay can also provide much-needed support for adaptation and loss and damage in vulnerable countries.

In conclusion, the study emphasizes the need to rebalance responsibility for climate action in line with actual emissions contributions is essential not just slow global warming but achieve more just resilient world.

Continue Reading

Climate

Climate-Driven Wildfires Wreaking Havoc on US Health and Economy

Scientists say human-caused climate change led to 15,000 additional early deaths from wildfire air pollution in the continental United States during the 15-year period ending in 2020.

Avatar photo

Published

on

Climate change is having a devastating impact on the United States, particularly when it comes to wildfires. A recent study published in Nature Communications Earth & Environment has found that human-caused climate change led to an additional 15,000 deaths from wildfire air pollution in the continental US during the 15-year period ending in 2020.

The study, led by Oregon State University researcher Bev Law, is the first to quantify the number of people dying due to a warming climate causing fires to release increasing amounts of fine particulate matter into the air. This phenomenon, known as PM2.5, can be inhaled deeply into the lungs and even enter the bloodstream, posing serious health risks.

The researchers estimate that during the study period, a total of 164,000 deaths resulted from wildfire PM2.5, with 15,000 of those attributed to climate change. This means that absent climate change, the total would have been 149,000. The average annual death rate from wildfire PM2.5 during this period was 5.14 per 100,000 people, roughly double the US death rate from tropical cyclones like hurricanes.

The economic burden associated with these extra deaths is staggering, estimated at $160 billion. This figure takes into account productivity losses, healthcare costs, and a concept known as value of statistical life, which assigns a monetary value to reduction in mortality risk.

California, Oregon, and Washington bore the greatest economic burden from climate-driven wildfire PM2.5, according to the study. “Without efforts to address climate change,” Law noted, “wildfires and associated fine particulate matter will continue to increase.” The researchers project that by midcentury, relative to the decade ending in 2020, mortality from smoke will rise by at least 50%, with resulting annual damages of $244 billion.

The study highlights the urgent need for action to address climate change and mitigate its impacts on human health. As Law emphasized, exposure to PM2.5 is a known cause of cardiovascular disease and is linked to the onset and worsening of respiratory illness. The ongoing trends of increasing wildfire severity track with climate projections, underscoring how climate change manifestations like earlier snowmelt, intensified heat waves, and drier air have already expanded forest fire extent and accelerated daily fire growth rates.

The research was conducted by an interdisciplinary team from Oregon State University, the University of California, Merced, the US Environmental Protection Agency, the Woodwell Climate Research Center, and Beth Israel Deaconess Medical Center of Harvard Medical School. Their findings serve as a stark reminder of the need for collective action to address the climate crisis and protect public health.

Continue Reading

Climate

2024 US Coastal Community Report Cards: Navigating Future Sea Levels with Data-Driven Insights

Researchers have released their 2024 U.S. sea level ‘report cards,’ providing updated analyses of sea level trends and projections for 36 coastal communities. Encompassing 55 years of historical data in a new, interactive dashboard, the report cards aid planning and adaptation efforts by forecasting rates of sea level rise to 2050.

Avatar photo

Published

on

The 2024 US Coastal Community Report Cards have been released by the William & Mary’s Batten School and VIMS, providing valuable insights into sea level trends and projections for 36 coastal communities across the country. This year’s report cards feature an interactive dashboard and incorporate data from additional tide gauge stations in Annapolis, MD; Solomons Island, MD; Yorktown, VA; and Fort Myers, FL.

Unlike average global sea level rise projections, these report cards consider regional factors such as geological uplift, land subsidence, ocean currents, and other processes that impact local sea levels. “Many people who live near the coast want to know what they can reasonably expect over the next few decades,” says Molly Mitchell, an assistant professor at the Batten School of Coastal & Marine Sciences & VIMS. “Our reports are created using observed tide gauge data from the past 55 years and reflect the exact experience at the location of the gauge.”

The report cards group localities into four regions: East Coast, Gulf Coast, West Coast, and Alaskan Coast. Each report card displays monthly sea level averages, high-and low-water levels caused by storms and other transient events, as well as a decadal signal showing the influence of longer-term climate patterns such as El Niño.

The projections also show the range of sea level rise within the 95% confidence interval, allowing individuals and municipalities to plan adequately for the highest predicted rates of sea level rise. Most locations continue a trend of accelerating sea level rise; however, Mitchell notes that projections have remained mostly uniform since reporting began in 2018, apart from a few notable exceptions.

“One interesting new trend is the acceleration occurring in southeastern states such as South Carolina and Georgia,” said Mitchell. “We continue to see the fastest rates of sea level rise in Gulf states like Texas and Louisiana, but many of the East Coast stations are accelerating quite quickly, likely due to patterns of water distribution related to glacial melt from the Greenland ice sheet.”

Mitchell also notes that most West Coast localities have been fairly stable, despite past predictions that they would increase rapidly. This has led to some questions about why.

Information about the processes most affecting regional sea levels is listed on the Batten School & VIMS website: List of cities, states and processes. Emeritus Professor John Boon launched the sea level report cards in 2018 following the publication of the study Anthropocene Sea Level Change: A History of Recent Trends Observed in the U.S. East, Gulf and West Coast Regions, which showed a notable increase in sea level acceleration rates beginning in 2013-2014.

Continue Reading

Trending