Connect with us
We’re experimenting with AI-generated content to help deliver information faster and more efficiently.
While we try to keep things accurate, this content is part of an ongoing experiment and may not always be reliable.
Please double-check important details — we’re not responsible for how the information is used.

Earth & Climate

Unveiling Hidden Populations: Drones Reveal 41,000-Turtle Nesting Site in Amazon Rainforest

A team at the University of Florida used drones and smart modeling to accurately count over 41,000 endangered turtles nesting along the Amazon’s Guaporé River—revealing the world’s largest known turtle nesting site. Their innovative technique, combining aerial imagery with statistical correction for turtle movement, exposes major flaws in traditional counting methods and opens doors to more precise wildlife monitoring worldwide.
Avatar photo

Published

on

The Amazon rainforest has long been a haven for biodiversity, but recent research has revealed a previously unknown scale of turtle populations in one of its most remote regions. A University of Florida research team, led by post-doctoral researcher Ismael Brack, has developed an innovative method to count wildlife using drones that has confirmed the world’s largest known nesting site for the threatened Giant South American River Turtle.

The researchers used a combination of aerial imagery and statistical modeling to document more than 41,000 turtles gathered along the Guaporé River. Their findings were published in the Journal of Applied Ecology and offer a new tool for conservationists seeking to monitor vulnerable animal populations with greater precision.

“We describe a novel way to more efficiently monitor animal populations,” said Brack. “And although the method is used to count turtles, it could also be applied to other species.”
The project began with researchers from the Wildlife Conservation Society (WCS) in Brazil, Colombia, and Bolivia, who are monitoring the Giant South American River Turtle, which is threatened by poachers who sell its meat and eggs. The turtles are exceptionally social creatures, and females congregate each year in July or August to nest in the Guaporé River sandbanks between Brazil and Bolivia.

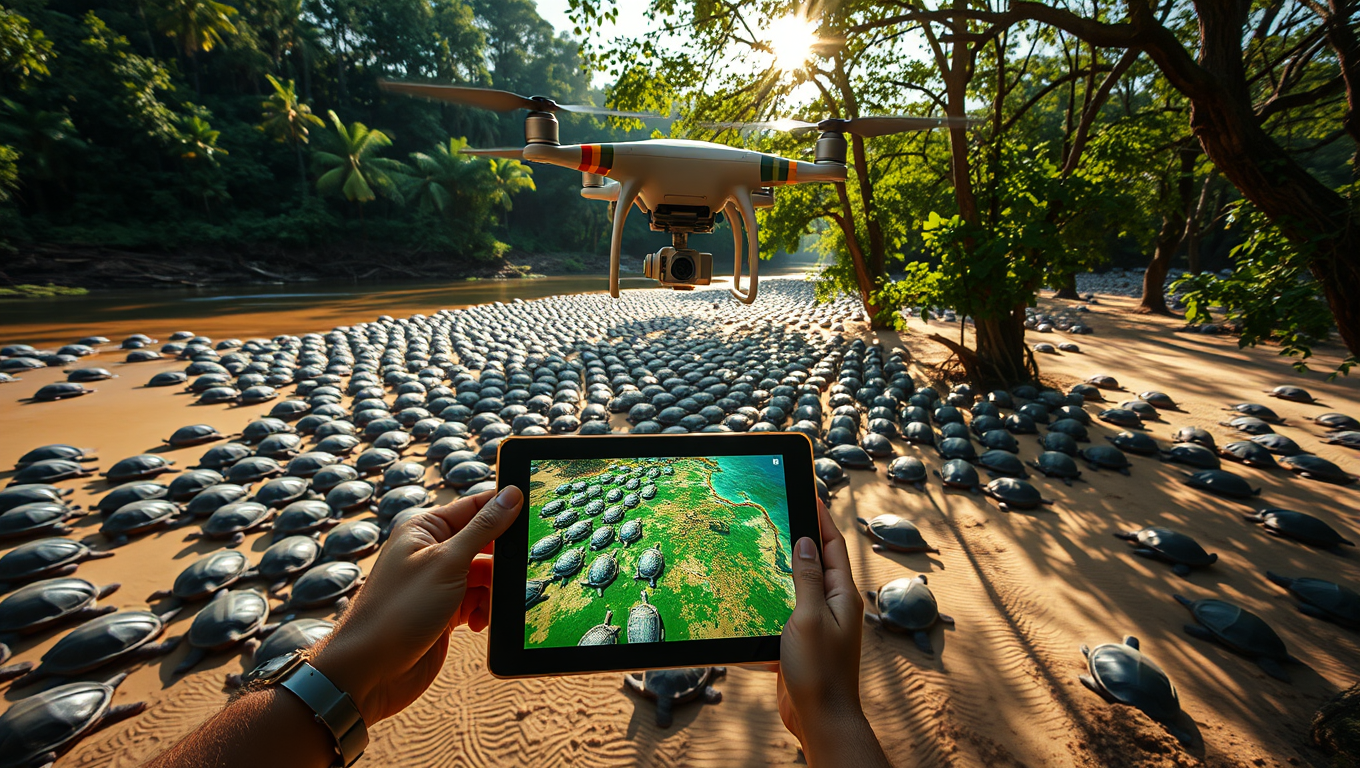
Brack met WCS scientists at a conference, where they shared how they use drones to count the turtles. They create orthomosaics, highly detailed, high-resolution composite images made by stitching together hundreds of overlapping aerial photographs. Counting animals shown in orthomosaics is a quicker, more accurate, and less-invasive approach than counting animals from the ground.

However, the method alone doesn’t account for the fact that animals sometimes move during observation. Together, researchers from UF and WCS developed a method that improves counting accuracy by eliminating multiple sources of error, including double counts (the same individual counted multiple times) and missed individuals.
Researchers used white paint to mark the shells of 1,187 turtles gathering on an island sandbank within the Guaporé River. Over 12 days, a drone flew overhead on a meticulous back-and-forth path four times a day and snapped 1,500 photos each time. Using software, scientists stitched the photos together, and researchers reviewed the composite images.
They recorded each turtle, if its shell was marked and whether the animal was nesting or walking when photographed. Equipped with this data, they developed probability models that account for individuals entering and leaving the area, observed turtle behaviors, and the likelihood of detecting an identifiable shell mark.

The models revealed several potential sources of error that could arise from traditional orthomosaic-based counts, according to the study. Only 35% of the turtles that used the sandbank were present during drone flights. And on average, 20% of those detected walking appeared multiple times in orthomosaics – some as many as seven times.
Observers on the ground counted about 16,000 turtles, according to the study. Researchers who reviewed the orthomosaics but didn’t account for animal movement or shell markings counted about 79,000 turtles. When they applied their models, however, they estimated about 41,000 turtles.

“These numbers vary greatly, and that’s a problem for conservationists,” Brack said. “If scientists are unable to establish an accurate count of individuals of a species, how will they know if the population is in decline or whether efforts to protect it are successful?”

The study describes ways to adapt and apply the approach to conservation efforts involving other species surveyed by drone-derived orthomosaics. Past monitoring studies have involved clipping seals’ fur, attaching high-visibility collars to elk, and marking mountain goats with paintball pellets to keep track of animal movement during counts.

The research team plans to perfect monitoring methods by conducting additional drone flights at the Guaporé River nesting site and in other South American countries where the Giant South American River Turtle gathers, including Colombia and possibly Peru and Venezuela. “By combining information from multiple surveys, we can detect population trends, and the Wildlife Conservation Society will know where to invest in conservation actions,” Brack said.

Air Quality

Greenland’s Glacial Runoff Fuels Explosive Growth in Ocean Life

NASA-backed simulations reveal that meltwater from Greenland’s Jakobshavn Glacier lifts deep-ocean nutrients to the surface, sparking large summer blooms of phytoplankton that feed the Arctic food web.

Avatar photo

Published

on

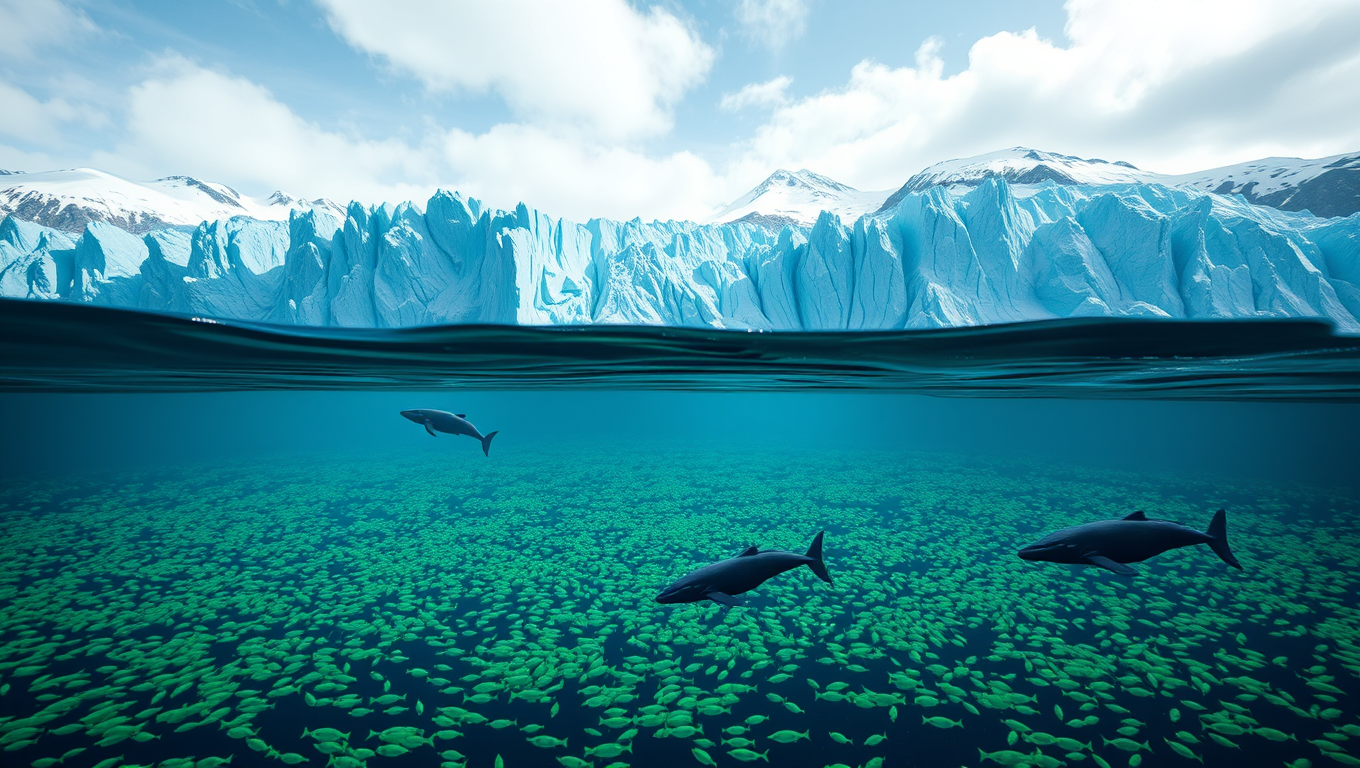
Greenland’s glacial runoff is fueling an explosion in ocean life, according to a recent study supported by NASA. As the ice sheet melts, it releases massive amounts of freshwater into the sea, which then interacts with the surrounding saltwater and nutrients from the depths.

The researchers used a state-of-the-art computer model called Estimating the Circulation and Climate of the Ocean-Darwin (ECCO-Darwin) to simulate the complex interactions between biology, chemistry, and physics in one pocket along Greenland’s coastline. The study revealed that glacial runoff delivers nutrients like iron and nitrate, essential for phytoplankton growth, to the surface waters.

Phytoplankton are tiny plant-like organisms that form the base of the ocean food web. They take up carbon dioxide and produce oxygen as byproducts of photosynthesis. In Arctic waters, their growth rate has surged 57% between 1998 and 2018 alone. The study found that glacial runoff boosts summertime phytoplankton growth by 15 to 40% in the study area.

Increased phytoplankton blooms can have a positive impact on Greenland’s marine animals and fisheries. However, untangling the impacts of climate change on the ecosystem will take time and further research. The team plans to extend their simulations to the whole Greenland coast and beyond.

The study also highlights the interconnectedness of the ocean ecosystem, with phytoplankton blooms influencing the carbon cycle both positively and negatively. While glacial runoff makes seawater less able to dissolve carbon dioxide, the bigger blooms of phytoplankton take up more carbon dioxide from the air as they photosynthesize, offsetting this loss.

The researchers emphasize that their approach is applicable to any region, making it a powerful tool for studying ocean ecosystems worldwide. As climate change continues to reshape our planet, understanding these complex interactions will be essential for predicting and mitigating its impacts on marine life and ecosystems.

Continue Reading

Atmosphere

NASA’s SWOT Satellite Captures Kamchatka Megaquake Tsunami in Stunning Detail

When a massive 8.8 magnitude earthquake struck off Russia’s Kamchatka Peninsula, NASA and CNES’s SWOT satellite captured a rare and detailed picture of the tsunami that followed. Recorded just over an hour after the quake, the satellite revealed the wave’s height, shape, and path, offering scientists an unprecedented multidimensional view from space.

Avatar photo

Published

on

The recent megaquake that struck off the coast of Russia’s Kamchatka Peninsula has been captured in striking detail by NASA’s SWOT satellite. Launched jointly with the French space agency CNES, the SWOT satellite is equipped with a unique radar system that can measure ocean topography and water levels across vast areas.

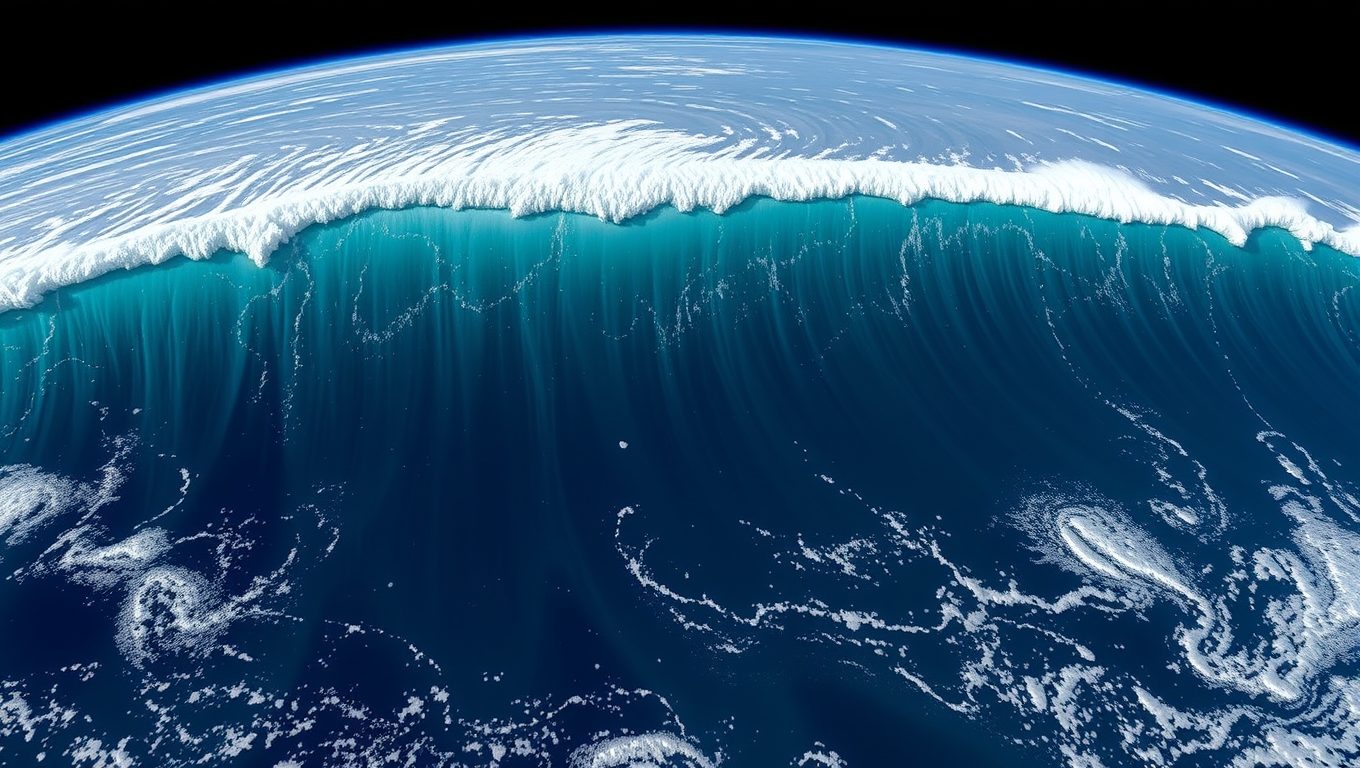
On July 30, at around 11:25 a.m. local time, an 8.8 magnitude earthquake struck off the coast of Kamchatka, generating a massive tsunami wave. The SWOT satellite captured the leading edge of this tsunami just 70 minutes after the quake hit. This remarkable footage has provided scientists with crucial data to improve tsunami forecast models.

The data collected by the SWOT satellite included measurements of the wave height exceeding 1.5 feet (45 centimeters), as well as a detailed look at the shape and direction of travel of the leading edge of the tsunami. These observations have been plotted against a forecast model produced by the U.S. National Oceanic and Atmospheric Administration (NOAA) Center for Tsunami Research.

Comparing these observations to the model helps forecasters validate their predictions, ensuring that they can provide accurate early warnings to coastal communities in the event of a tsunami. As Nadya Vinogradova Shiffer, NASA Earth lead and SWOT program scientist at NASA Headquarters, explained, “The power of SWOT’s broad, paintbrush-like strokes over the ocean is in providing crucial real-world validation, unlocking new physics, and marking a leap towards more accurate early warnings and safer futures.”

Ben Hamlington, an oceanographer at NASA’s Jet Propulsion Laboratory, highlighted the significance of the 1.5-foot-tall wave captured by SWOT, saying that what might seem like a small wave in open waters can become a massive 30-foot wave in shallower coastal areas.

The data collected by the SWOT satellite has already helped scientists improve their tsunami forecast models at NOAA’s Center for Tsunami Research. This is a crucial step towards enhancing operational tsunami forecasts and saving lives. As Josh Willis, a JPL oceanographer, noted, “The satellite observations help researchers to better reverse engineer the cause of a tsunami, and in this case, they also showed us that NOAA’s tsunami forecast was right on the money.”

This breakthrough has significant implications for coastal communities around the world. By providing more accurate early warnings, SWOT data can save lives and reduce damage caused by tsunamis. As Vasily Titov, the center’s chief scientist in Seattle, emphasized, “It suggests SWOT data could significantly enhance operational tsunami forecasts — a capability sought since the 2004 Sumatra event.” The devastating tsunami generated by that quake killed thousands of people and caused widespread destruction in Indonesia.

The SWOT satellite was jointly developed by NASA and CNES, with contributions from the Canadian Space Agency (CSA) and the UK Space Agency. NASA JPL leads the U.S. component of the project, providing a Ka-band radar interferometer instrument, a GPS science receiver, a laser retroreflector, a two-beam microwave radiometer, and NASA instrument operations.

This groundbreaking technology has opened up new possibilities for scientists to better understand ocean dynamics and improve tsunami forecasting models. As SWOT continues to capture stunning images of our oceans, it will undoubtedly play a vital role in enhancing operational tsunami forecasts and saving lives around the world.

Continue Reading

Climate

The Ocean’s Fragile Fortresses: Uncovering the Impact of Climate Change on Bryozoans

Mediterranean bryozoans, including the “false coral,” are showing alarming changes in structure and microbiomes under acidification and warming. Field studies at volcanic CO₂ vents reveal that these stressors combined sharply reduce survival, posing risks to marine ecosystems.

Avatar photo

Published

on

The Ocean’s Fragile Fortresses: Uncovering the Impact of Climate Change on Bryozoans

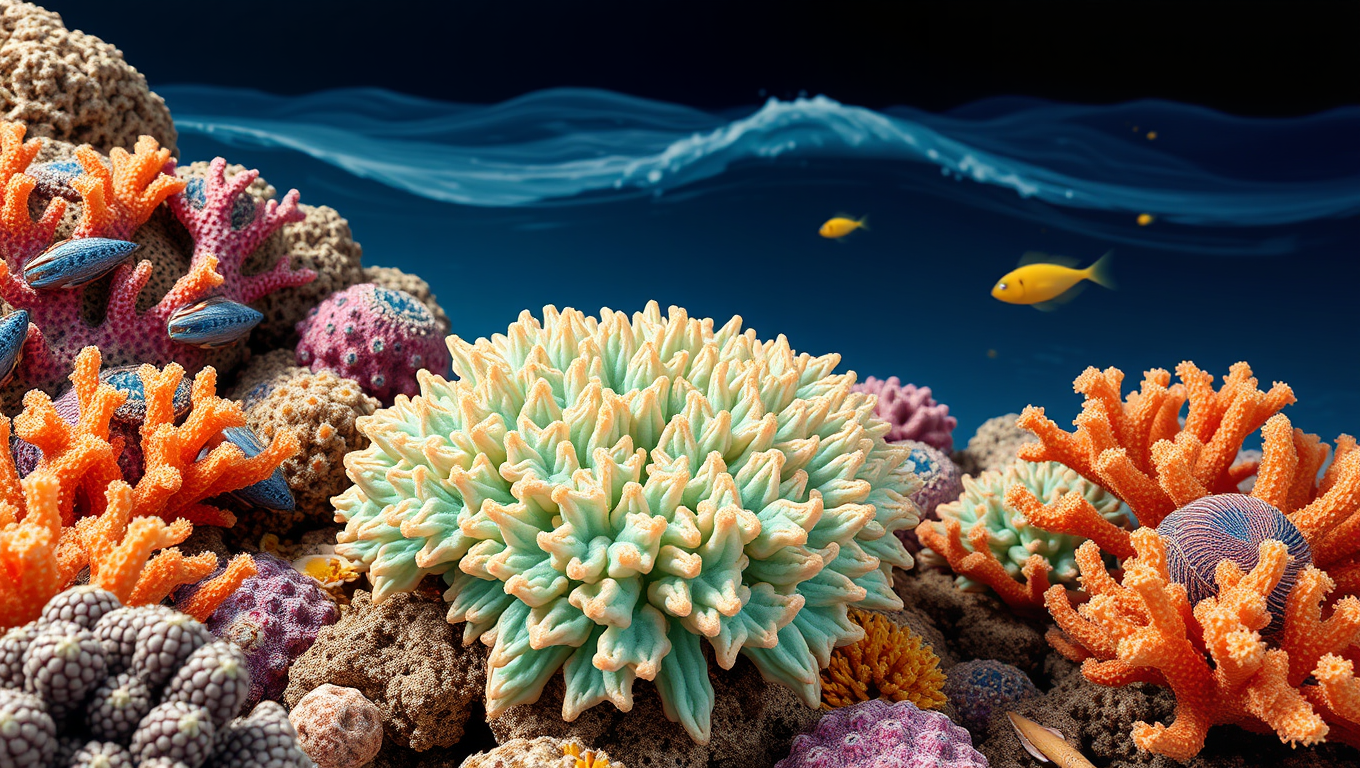
Bryozoans, small colonial invertebrates, play a vital role in forming marine habitats. However, their response to environmental changes has long been overlooked. A recent study published in Communications Biology sheds light on how ocean acidification and warming can affect bryozoan colonies, with crucial implications for marine conservation.

The researchers from the Institut de Ciències del Mar (ICM-CSIC) used a natural laboratory on the island of Ischia, Italy, to simulate the conditions projected for the end of the century. They analyzed the morphology, skeleton mineralogy, and microbiome of two bryozoan species exposed to these conditions. The findings revealed that the species exhibit some acclimation capacity, modifying their skeletal mineralogy to become more resistant.

However, a loss in functional microbial diversity was observed, with a decline in genera potentially involved in key processes such as nutrition, defense, or resistance to environmental stress. This suggests that even if colonies look externally healthy, changes in the microbiome could serve as early bioindicators of environmental stress.

The study also considered the effects of rising temperatures, another key factor in climate change. The models used indicate that the combination of these two stressors intensifies the effects observed, significantly reducing the coverage of the encrusting bryozoan and increasing mortality.

These findings have important implications for marine conservation. Habitat-forming species like bryozoans are not only vulnerable but their disappearance could trigger cascading effects on many other species that rely on them for shelter or food. The characterization of the microbiome and preliminary identification of potentially beneficial microorganisms open new research avenues to enhance the resilience of holobionts (host and its associated microbiome) through nature-based approaches.

The complexity of this issue demands integrated analyses, highlighting the importance of interdisciplinary approaches in anticipating future scenarios and protecting marine ecosystems.

Continue Reading

Trending