While we try to keep things accurate, this content is part of an ongoing experiment and may not always be reliable.
Please double-check important details — we’re not responsible for how the information is used.
Earth & Climate
Clothes Dryers and the Bottom Line: The Savings of Switching to Air Drying
By replacing clothes dyers with line drying, households in the U.S. could save upwards of $2,100 and avoid 3 tons of carbon dioxide emissions over the lifetime of a dryer. The exact impacts, however, depend on what kind of dryer you have and where you live, new research shows.


Air Quality
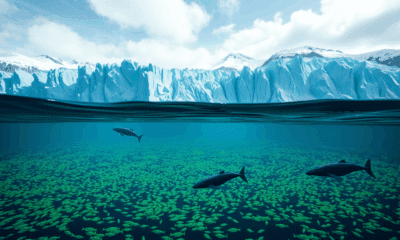
Greenland’s Glacial Runoff Fuels Explosive Growth in Ocean Life
NASA-backed simulations reveal that meltwater from Greenland’s Jakobshavn Glacier lifts deep-ocean nutrients to the surface, sparking large summer blooms of phytoplankton that feed the Arctic food web.

Atmosphere
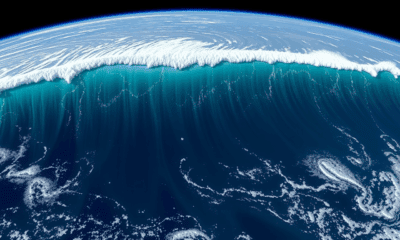
NASA’s SWOT Satellite Captures Kamchatka Megaquake Tsunami in Stunning Detail
When a massive 8.8 magnitude earthquake struck off Russia’s Kamchatka Peninsula, NASA and CNES’s SWOT satellite captured a rare and detailed picture of the tsunami that followed. Recorded just over an hour after the quake, the satellite revealed the wave’s height, shape, and path, offering scientists an unprecedented multidimensional view from space.

Climate
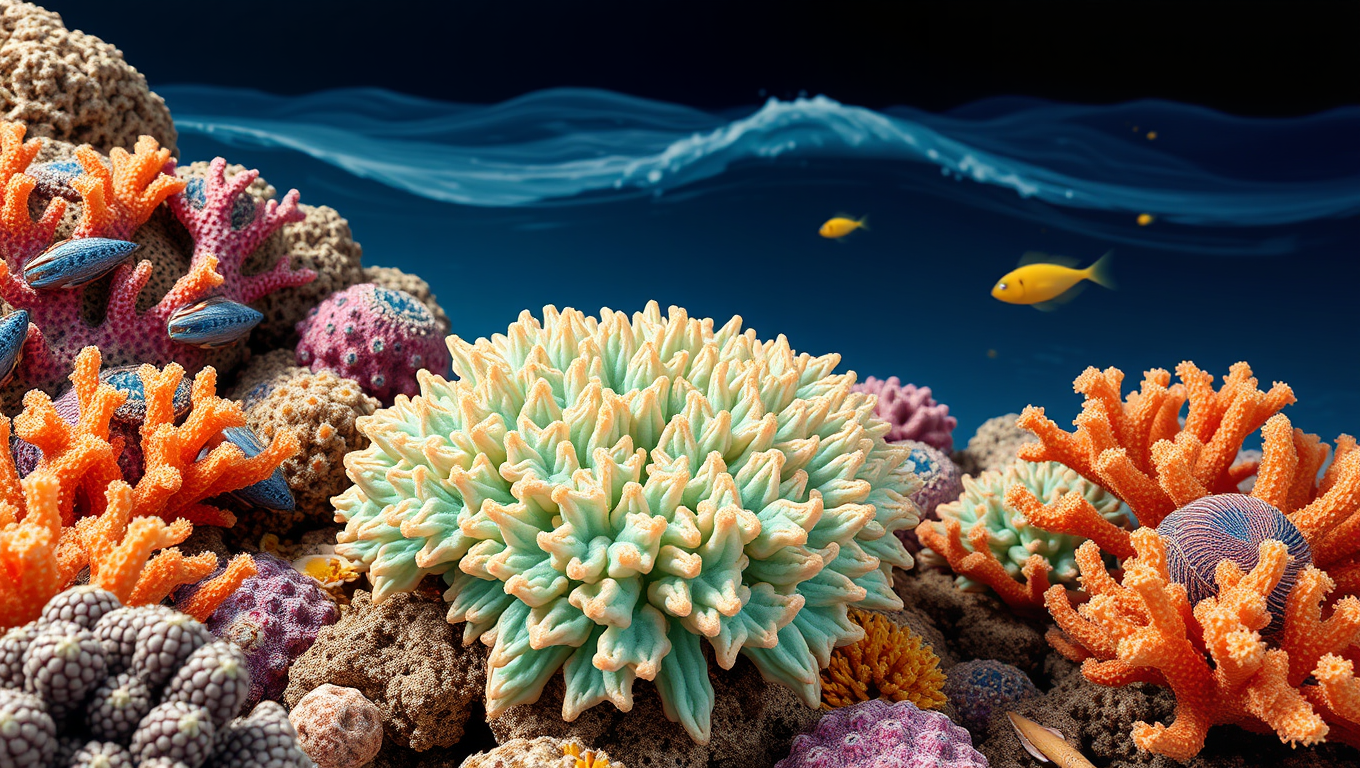
The Ocean’s Fragile Fortresses: Uncovering the Impact of Climate Change on Bryozoans
Mediterranean bryozoans, including the “false coral,” are showing alarming changes in structure and microbiomes under acidification and warming. Field studies at volcanic CO₂ vents reveal that these stressors combined sharply reduce survival, posing risks to marine ecosystems.

A New Horizon for Vision: How Gold Nanoparticles May Restore People’s Sight

Revolutionizing Quantum Communication: Direct Connections Between Multiple Processors

Retiring Abroad Can Be Lonely Business
Harnessing Water Waves: A Breakthrough in Controlling Floating Objects

Household Electricity Three Times More Expensive Than Upcoming ‘Eco-Friendly’ Aviation E-Fuels, Study Reveals

“Unveiling Hidden Patterns: A New Twist on Interference Phenomena”
Reducing Falls Among Elderly Women with Polypharmacy through Exercise Intervention
-
 Detectors1 year ago
A New Horizon for Vision: How Gold Nanoparticles May Restore People’s Sight
-
Cancer1 year ago
Revolutionizing Quantum Communication: Direct Connections Between Multiple Processors
-
Earth & Climate1 year ago
Retiring Abroad Can Be Lonely Business
-
Albert Einstein1 year ago
Harnessing Water Waves: A Breakthrough in Controlling Floating Objects
-
Earth & Climate1 year ago
Household Electricity Three Times More Expensive Than Upcoming ‘Eco-Friendly’ Aviation E-Fuels, Study Reveals
-
Chemistry1 year ago
“Unveiling Hidden Patterns: A New Twist on Interference Phenomena”
-
Diseases and Conditions1 year ago
Reducing Falls Among Elderly Women with Polypharmacy through Exercise Intervention
-
Earth & Climate1 year ago
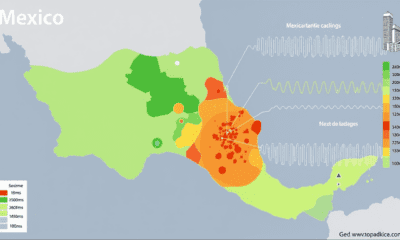
Predicting Damage from Local Earthquakes in Mexico City